Hey Tea Partiers! Direct Your Outrage Here;Bush Great Recession Cost Average American Households $100,000

Meagan Barth! Are you there? And where are you Chuck DeVore.  DeMint! You were just in OC.  Hey Van Tran, I can tell you apart from Lou Correa.  Scott Baugh, place your notes on your TeaParty Crate and direct your eyes this way.  A new report authored by a former George W. Bush Treasury Official says The Great Bush Recession cost American Households nearly $100,000 each in lost assets and lost income. 

Jobs chart

So is this another “Blame Bush” post? It sure is. But I have stats. I. Have. Stats.  See the notes below courtesy of Speaker Pelosi’s office.

 New Report:  Bush Economic Crisis Cost American Households Nearly $100,000 in Lost Income and Assets  

  • Congressional Republicans threaten to take us back to the failed policies that created the economic crisis — siding with the special interests:  Wall Street banks, credit card companies, Big Oil, and insurance companies.  
  • These Bush economic and fiscal policies created the worst financial crisis since the Great Depression — with job losses of nearly 800,000 a month—and nearly doubled our national debt. 
  • Democrats in Congress will continue to take America in a New Direction, working to create American jobs and a strong new foundation for economy, protecting Main Street and the middle class. 

A new report by the Pew Financial Reform Project, written by a former Bush Treasury official, details the  devastating costs to American families of the economic crisis caused by the Republican failure to provide oversight to Wall Street and to invest in a globally competitive economy.

The financial crisis had “a massive impact on the United States.  Millions of American families suffered losses of jobs, incomes, and homes – the effects of these losses will play out on society for generations to come.” 

According to the report, the crisis – at its peak – cost the typical American family nearly $100,000 in lost wages and declining stock and home values.

GDP chart

As a result of the failed economic policies of the Bush Administration (from the report) –    

  • Slower economic growth equaling an average of $5,800 in lost income for each American family. (October 2008 – December 2009)  
  • 5.5 million more jobs lost and lost wages averaging $3,250 per household. (October 2008 – December 2009)
  • $3.4 trillion in lost home values – or $30,300 per American family – and half a million more home foreclosures. (July 2008 – March 2009) 
  • $7.4 trillion in stock value lost – $66,200 average per U.S. household. (July 2008 – March 2009)

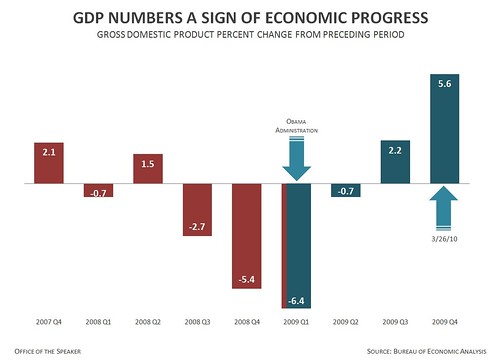
Congressional Democrats, together with President Obama, have been working diligently to ensure economic stability and opportunity for American workers, their families and small businesses. 

Recent economic data shows the economy is beginning to head in the right direction.  Why would we go back to the failed Bush policies that created the crisis? 

Household wealth chart

stock market chart

JOBS
In January 2009, before Congress passed the Recovery Act, Americans lost 779,000 jobs in one month alone. A year later, job losses have turned to jobs gains of 162,000 in March, including 17,000 in manufacturing—a complete reversal from what President Bush left behind.

ECONOMIC GROWTH
In the 1st quarter of 2009, starting before President Obama took office, America’s GDP fell by 6.4 percent. By the end of the year, our economy grew by 5.6 percent—the fastest three-quarter swing in almost three decades. 12 points in less than 12 months.

 HOUSEHOLD WEALTH
Since the Recovery Act took effect, Americans regained nearly 30 percent ($5 trillion) of the $17.5 trillion in household wealth wiped out during the last 18 months of the Bush Administration.


STOCK MARKET
The Dow is at an 18-month high of over 11,000, an increase of more than 4,000 points—or 70%—in just over a year of the Obama presidency.


MANUFACTURING
America’s manufacturing base has grown for eight straight months—now at the highest level in six years—with manufacturing jobs being created three months in a row.

CONSUMER SPENDING & RETAIL SALES
Consumer spending is up five months in a row, with household purchases on track to expand at a 3.4 percent pace this quarter, the best performance in three years. Retail sales rose by 1.6 percent in March, the third consecutive month of growth.


TeaBagging indeed!

2 Comments

  1. Where’s your graph on unemployment? That’s been a terrific success for the Messiah and illegal alien protector.

Comments are closed.